Historyplot
ライセンス:修正BSDライセンス
動作環境:Windows、Mac、Linux(京コンピュータを含む)
ソフトウェアの特徴
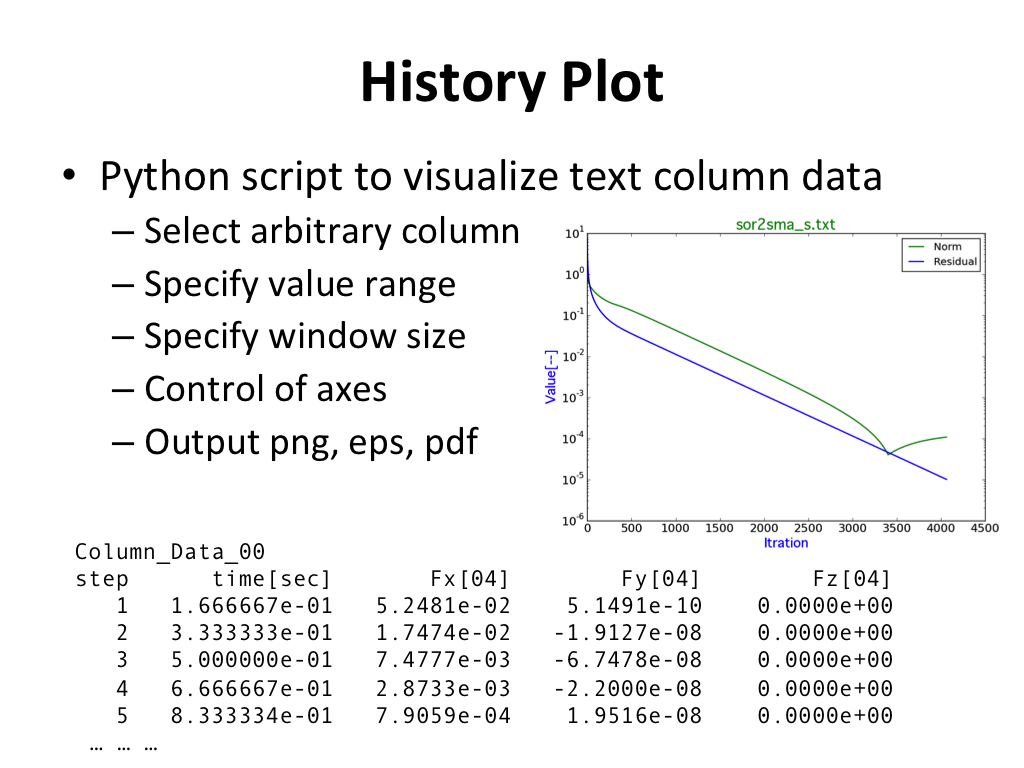
指定されたフォーマットで記述された入力データをもとにグラフを作図するツールです。

Abstract of Historyplot
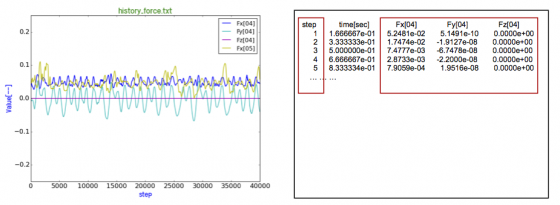
1. 汎用データフォーマット
- "Column_Data_**" の記述 によりデータブロックを識別します。(今後、複数のブロックを識別できる予定です。)
- "Column_Data_00" からデータの最後まで、空行挿入は不可。
| (...スペースやほかの文字列行) |
| Column_Data_00 |
| step |
time[sec] |
Fx[04] |
Fy[04] |
Fz[04] |
| 1 |
1.666667e-01 |
5.2481e-02 |
5.1491e-10 |
0.0000e+00 |
| 2 |
3.333333e-01 |
1.7474e-02 |
-1.9127e-08 |
0.0000e+00 |
| 3 |
5.000000e-01 |
7.4777e-03 |
-6.7478e-08 |
0.0000e+00 |
| 4 |
6.666667e-01 |
2.8733e-03 |
-2.2000e-08 |
0.0000e+00 |
| 5 |
8.333334e-01 |
7.9059e-04 |
1.9516e-08 |
0.0000e+00 |
|
2. Python プログラムの構成
| Pythonスクリプト |
説明 |
| PlotColumnData.py |
上記の汎用カラムデータの作図 |
| FileIOColumnData.py |
汎用カラムデータを読み込む |
| PlotOption.py |
作図オプションの設定 |
| FileIO.py |
FFV Performance Dataを読み込む |
| ParamDef.py |
内部のパラメータの定義 |
| PlotMatplotlib.py |
MatPlotLibを駆動する部分 |
| PlotPerformanceData.py |
FFV Performance Data作図用 |
| Quantile.py |
箱型(BoxPlot)図作図用の計算ツール |
3. 作図コマンド
python PlotColumnData.py -h を実行すると、下記のメッセージが表示されます:
| Usage: PlotColumnData.py [options] |
| Options: |
| -h, --help |
show this help message and exit |
| -f INPUT_FILE, --file=INPUT_FILE |
input file name |
|
(入力ファイル名、省略不可) |
| -x X_INDEX, --xindex=X_INDEX |
column index used as X data |
|
(Xデータ列index、省略可、Default=0) |
| -y Y_ INDEX, --yindex=Y_INDEX |
column index(indices) used as Y data, e.g. 1 2 3-8 |
|
(Yデータ列indexの範囲、省略不可) |
| -t TITLE, --title=TITLE |
title of the plot, by default, it is input file name |
|
(図のタイトル、省略可、Default=入力ファイル名) |
| -l Y_LABEL, --ylabel=Y_LABEL |
label of Y axis |
|
(Y軸のラベル) |
| --log or --logy |
switch for logarithmic y-scale |
|
(対数Y軸のスイッチ、省略する場合、線形Y軸) |
| --xx or --xrange |
range of X axis |
|
(X軸の範囲、省略する場合、データの範囲になる) |
| --yy or --yrange |
range of Y axis |
|
(Y軸の範囲、省略する場合、データの範囲になる) |
| --img or --image |
extension name of output image(eps, pdf, png, ps) |
|
(出力画像の拡張子、省略する場合、pngになる) |
| --windize |
size of the plot window(unit: inch) |
|
(出力画像のサイズ、省略する場合、10"×7") |
|
- 上記のoptions の入力順番は自由です。-f と -y は必須のオプションです。
- Yデータ列indexの範囲を指定する際に、必ず "" を使用して下さい(例: -y "1 2 5-9")。指定したYデータ列のindexは自動的に分析されるので、重複指定があったり列数が超過していても構いません。
- 一般的には、短いoptionsの使用を推奨します。長いoptionsを使用する場合、先頭に--を使用して下さい。例えば、--file, --xindex, --yindex, --title, --ylabel, --log, --img, --xx, --yy など。
- --xrangeの設定は二つの値が必要です、例えば--xrange "0.1 0.3" は、最大値と最小値を示します。パラメータが一つの値の場合、例えば、--xrange "0.3" は、暗黙で最小値は 0.0 になり、入力値は最大値となります。--yrangeも同様です。
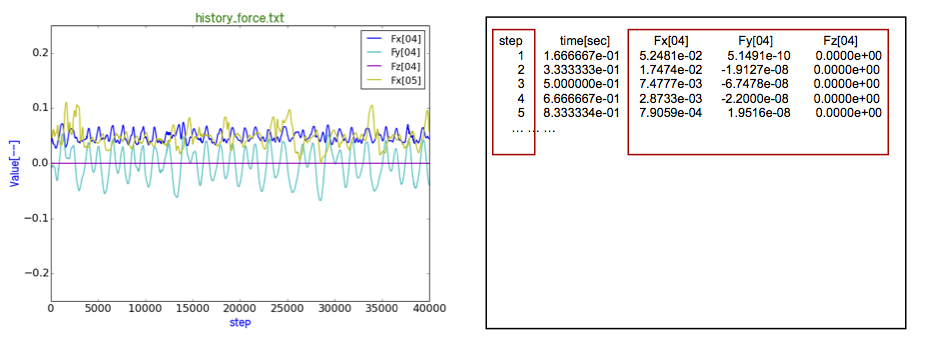
4. 作図コマンドで指定されるデータ範囲と出力されるグラフ
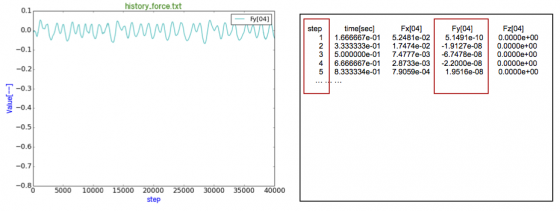
python PlotColumnData.py -f history_force.txt -x 0 -y “2-5” --yyrange “-0.25 0.25”
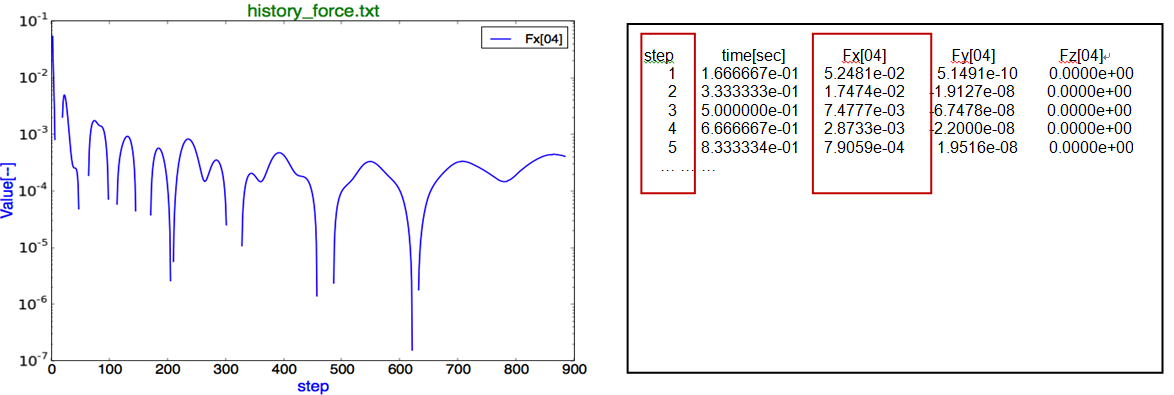
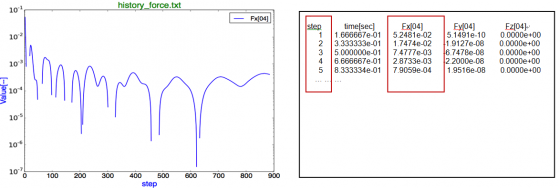
python PlotColumnData.py -f history_force.txt -x 0 -y 3
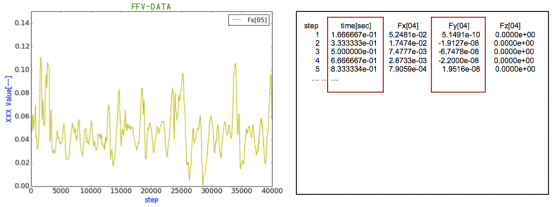
python PlotColumnData.py -f history_force.txt -x 1 -y 3 --ylabel “XXX Value[--]” --title FFV-DATA
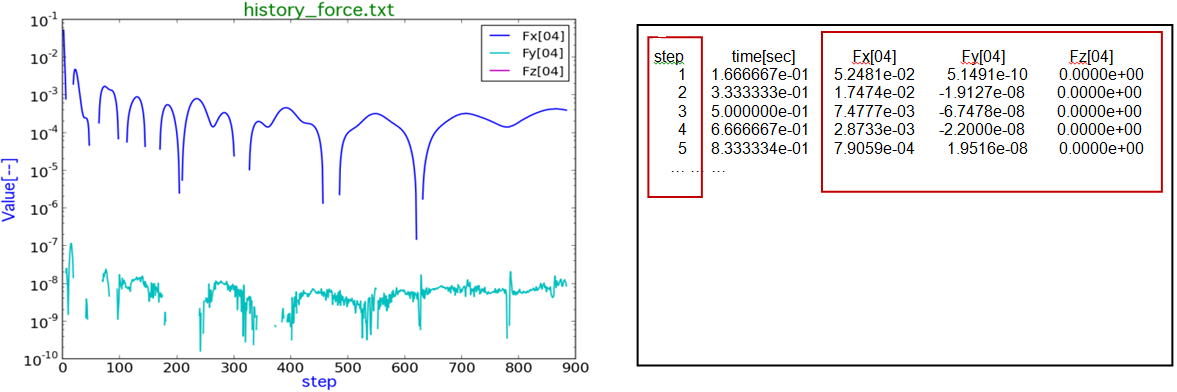
python PlotColumnData.py -f history_force.txt -x 0 -y "2 2" --log
注: Python2.7.5使用、Python2.7.2作図エラー
python PlotColumnData.py --file history_force.txt -xindex 0 - yindex "2 4" --log

注: Python2.7.5使用、Python2.7.2作図エラー
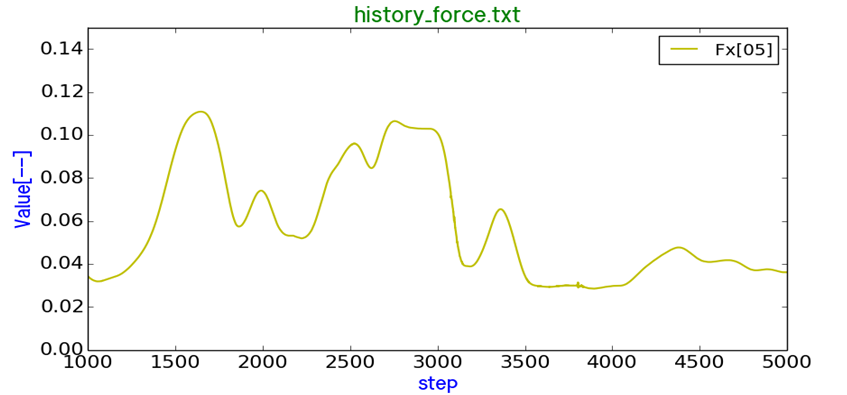
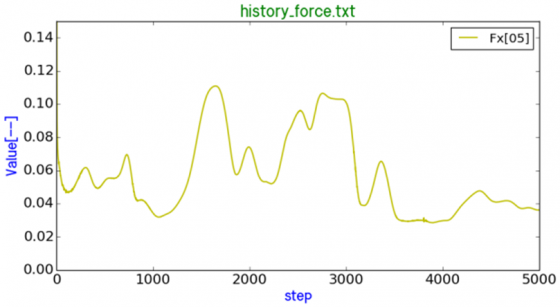
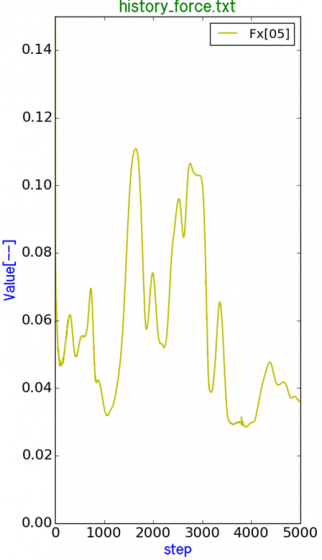
python PlotColumnData.py --file history_force.txt -x 0 - y 5 -yy 0.15 -xx "1000 5000"

注: プロットされたデータの最大値・最小値が表示され、X, Yの範囲を設定する例です。
plot: Fx[05] index=5
X range: min= 1.0 max=39999.0 avg=20000.0
Y range: min=0.0005 max=9.595 avg=0.047
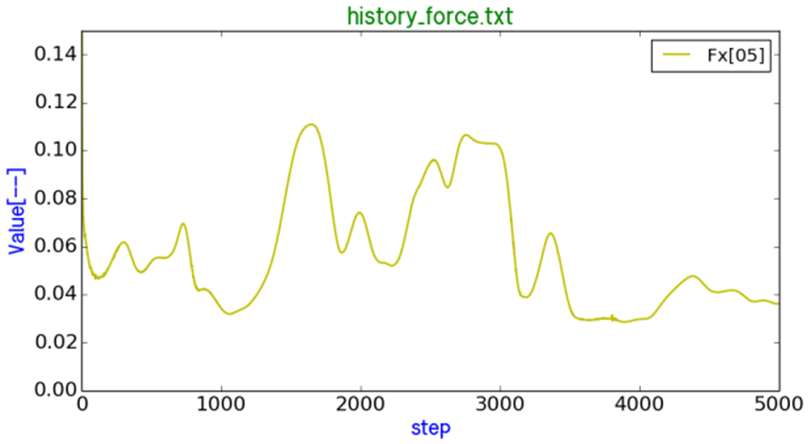
python PlotColumnData.py --file history_force.txt -x 0 - y 5 -yy 0.15 -xx 5000 -winsize "10 5"
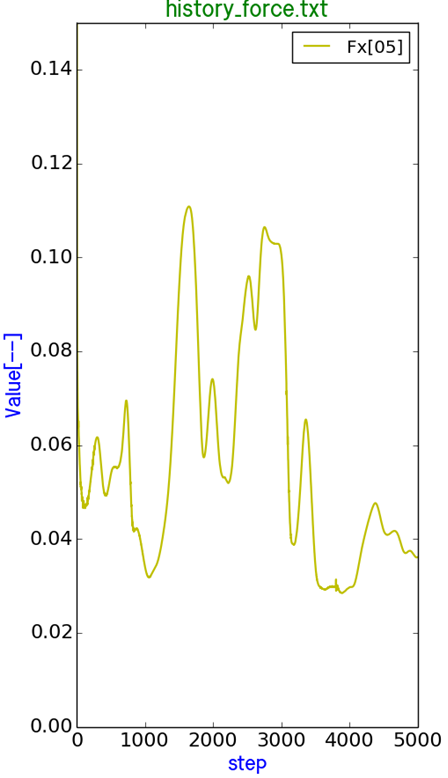
python PlotColumnData.py --file history_force.txt -x 0 - y 5 -yy 0.15 -xx 5000 -winsize "5 10"
5. 補足
① 日本語フォントの設定
PlotMatplotlib.py に各OSに使用されるフォントのパスが定義されています。
| # 日本語fontの設定 |
|
| g_fontsize = 18 |
|
|
| if param.G_WINDOWS == 1: |
# for Windows |
| font_path = 'konatu.ttf' |
| # ----------------------------------------------------------------- |
| # 『小夏』("Konatu") Copyright (C) 2002~ 桝田道也 All rights reserved. MIT License |
| # http://avoidnotes.org/urlmemo/cache/20050722191344.html#about |
| # ----------------------------------------------------------------- |
| elif param.G_MACOSX == 1: |
# for Mac |
| font_path = '/Library/Fonts/Osaka.ttf' |
| elif param.G_LINUX_K == 1 : |
# for Linux of K-Computer |
| font_path = '/Please/Specify/ProperFont.ttf' |
| elif param.G_LINUX_FOCUS == 1 : |
# for Linux of FOCUS |
| font_path = '/Please/Specify/ProperFont.ttf' |
| else: |
# for CentOS |
| font_path = '/usr/share/fonts/ja/TrueType/kochi-gothic-subst.ttf' |
|
- Windowsの環境で、日本語フォントを使用する場合、TTFフォントを使用しないと、pdf、epsフォーマットの画像を保存できません。ここで、桝田道也氏の『小夏』("Konatu") フォントを使用します。(Copyright (C) 2002~ 桝田道也 All rights reserved. MIT License)
- 同梱のkonatu.ttfは、Windows, MacOSに使用できます。G_WINDOWS == 1の場合、Mac OSXの環境でも、プログラムは正常動作します。(確認済)
- Linuxの環境で、フォントのインストールティレクトリは異なる可能性がありますので、確認してから、上記のパスを設定して下さい。一般のLinuxの環境でも、『小夏』フォントkonatu.ttfを使用できる可能性があります。(要確認)
② ParamDef.pyの設定
| #日本語の文字化けを防止するために、このパラメータを1にして下さい。 |
| #出力先がファイルで、エンコードエラーを起こす時に、これを0にして下さい。 |
| G_DECODE_STR = 1 |
|
|
| #プラットフォームによって、下記のいずれか一つを1にして下さい。 |
| G_WINDOWS = 1 |
|
| G_MACOSX = 0 |
|
| G_LINUX = 0 |
|
| G_LINUX_K = 0 |
|
| G_LINUX_FOCUS = 0 |
|
|
| #Please use 'Agg' If it issues following error: |
| #"no display name and no $DISPLAY environment" |
| #Agg is a non-interactive backend, it won't display |
| #on the screen, Show() does not work, it saves to files. |
| if G_LINUX_K == 1 : G_USE_AGG = 1 |
| else: G_USE_AGG = 0 |
|
③ 作図の仕様の設定
各カラムのデータの範囲が異なるものを同じグラフに入れる場合、見にくくなる可能性がありますので、別々での作図を薦めます。また、PlotColumnData.pyを編集すれば、図の詳細仕様を調整することができます、下の図の赤色の行は修正の一例です。
| ############ 作図仕様 ########################## |
| #---------------------------------------------- |
| #出力PNG画像ファイル名中に使えない文字を '_' に置換 |
| png_name = 'image_plot' + graph_title |
| png_name = verify_filename(png_name) |
| png_name = png_name + '.png' |
|
| # 作図仕様を指定する |
| opt2 = PlotOption() |
| opt2.set_figsize( 10, 7 ) |
| opt2.set_title( graph_title, 20, 'green' ) |
| opt2.set_label( x_label, y_label, 18, 'blue' ) |
| #opt2.set_xrange( 0, n_max ) |
| #opt2.set_yrange( 0, 0.025 ) |
| #opt2.set_draw( 'b', 'k', 0.6 ) |
| #opt2.set_text( graph_title, 0.80, 0.90, 16, 'red', 0.3 ) |
| #opt2.set_figcolor( 'lightgoldenrodyellow', 0.2 ) |
| #opt2.set_tick( 'red', 16, 0, 0 ) |
| opt2.set_pngname(png_name) |
| # ------------------------------------------------ |
|
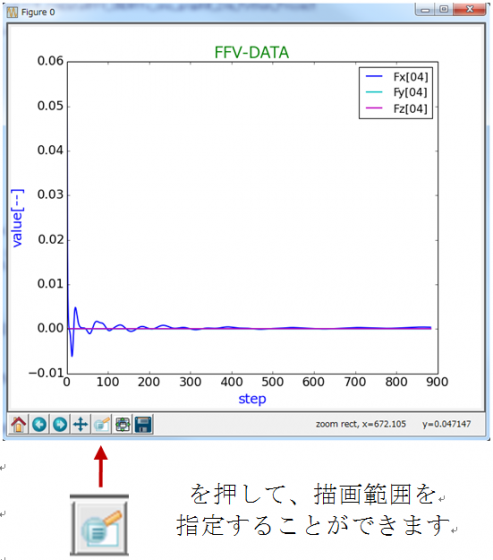
④ 図の調整方法
1) 描画範囲を指定します。
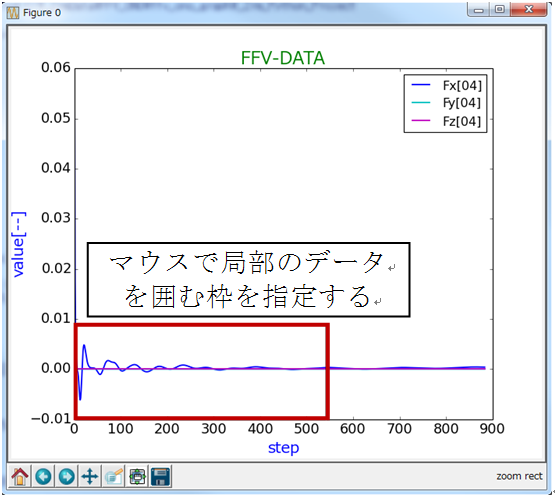
2) マウスで局部のデータを囲む枠を指定します。
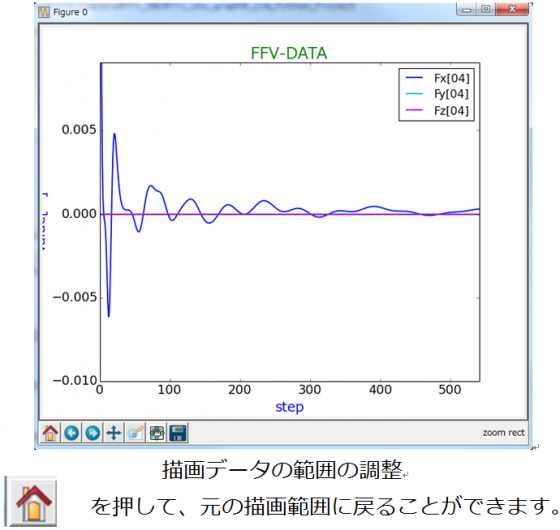
3) 枠で指定されたデータが表示されます。
⑤ Y軸の対数軸設定について
Python 2.7.2 でテストしましたが、show()を呼出すと、下記のエラーが発生します:
| File "C:\Python27\lib\site-packages\matplotlib\mathtext.py", line 2193 - ((lbrace + float_literal + rbrace) |
| TypeError: unsupported operand type(s) for +: 'NoneType' and 'NoneType' |
|
Python2.7.5を使用すれば、図が正しく表示されます。
ダウンロードは次のページから可能です。
Historyplot